
JUXTUM VIEW

Maximize Manufacturing Efficiency and Profits With OEE Software

Turn Your Shop Floor Data Into Production Gains

Collecting machine data is only half the problem. Without a way to visualize and act on it in real time, production decisions still get made on end-of-shift summaries and gut feel, while utilization gaps, missed alarm patterns, and gradual cycle time losses quietly erode output and margin. Juxtum’s solution is a real-time machine monitoring and visualization platform that turns standardized shop floor data into actionable production insights, giving your entire team a live, accurate picture of how every connected asset is performing.

PERFORMANCE INSIGHT

Real-time Visibility Into Equipment Effectiveness

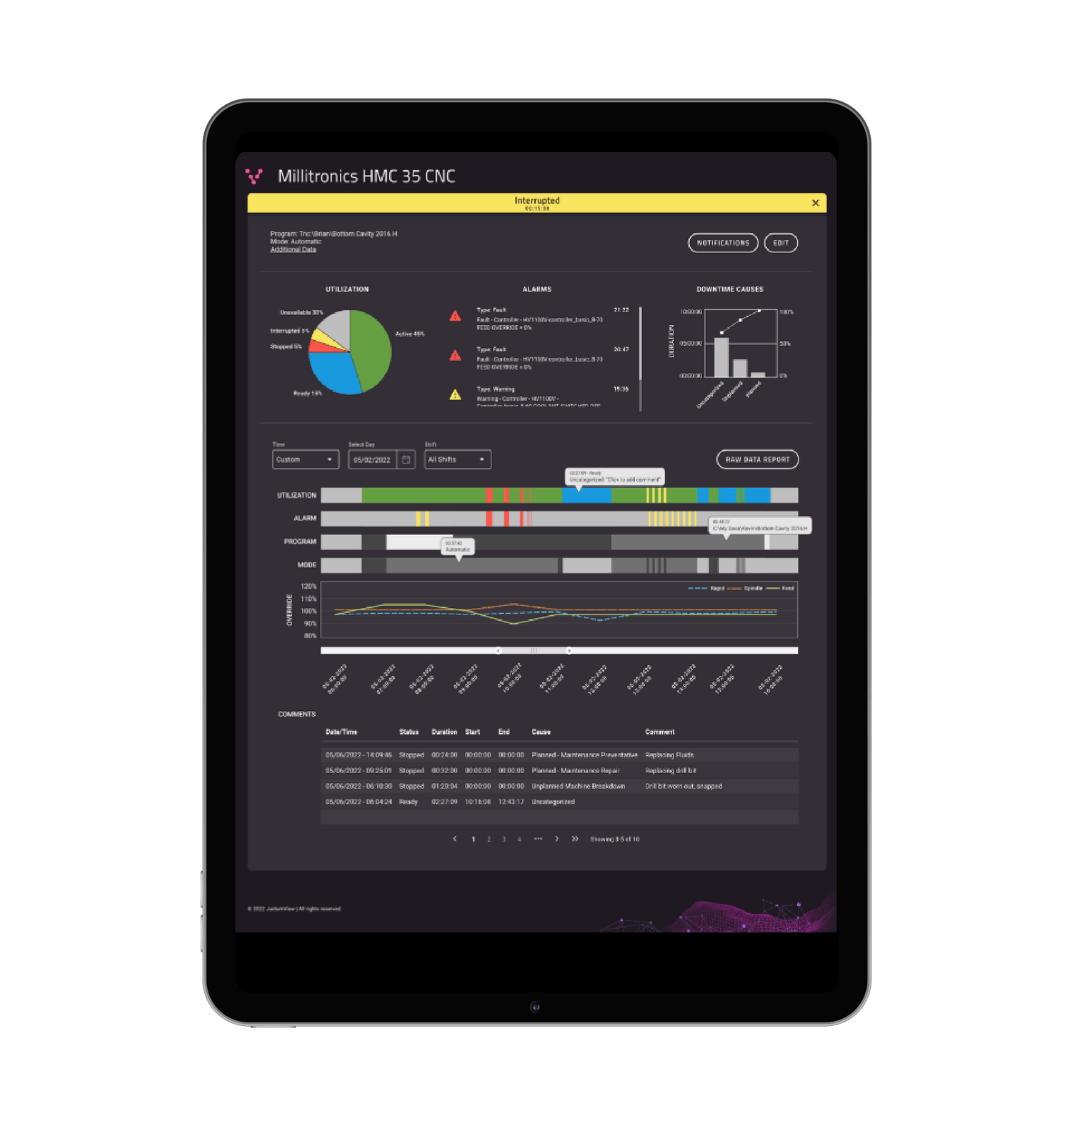
Juxtum View gives operations managers and engineers a live, accurate view of utilization rates, cycle times, alarm activity, and production trends across every connected asset. Dashboards update continuously as machines run, so instead of waiting until the end of a shift to find out what went wrong, your team sees developing issues as they happen and can act immediately. That moves teams from reactive problem-solving to proactive performance management.

IDENTIFY HIDDEN BOTTLENECKS

Detect early warning signs like alarms, temperature changes, and feed rate inconsistencies before they turn into costly downtime.

Unplanned downtime is one of the most expensive problems in discrete manufacturing. A machine stops unexpectedly, production halts, downstream equipment sits idle, and cost compounds quickly across the facility. Emergency service calls, overtime labor, and missed delivery commitments can compound quickly across the facility.

What makes unplanned downtime particularly costly is that it rarely appears without warning. Alarm signals, drive temperature fluctuations, and feed rate inconsistencies frequently appear before a failure occurs. Without a system in place to monitor those signals continuously, the warnings go unnoticed until it is too late. Juxtum View monitors production data across all connected assets and tracks alarm activity and signal behavior over time, notifying your team when a pattern suggests a developing issue before it becomes a production stoppage.

DRIVE CONTINUOUS IMPROVEMENT

Track OEE, cycle times, and utilization trends to identify underperformance and make data-backed improvements across your operation.

Continuous improvement programs depend on accurate, consistent data. Without it, process changes are based on assumptions rather than on what machines are actually reporting. Juxtum View gives your team the production data foundation that continuous improvement requires. By tracking OEE scores, cycle times, parts produced, utilization rates, and alarm trends over time, your operations team can identify which machines, shifts, or production lines are underperforming and why.

Those same insights scale across shifts, machines, and facilities, giving multi-site manufacturers a consistent, standardized view of production performance across every location. That level of visibility gives your entire organization a shared, evidence-based foundation for improvement decisions.

TURN IDLE TIME PRODUCTIVE

Uncover hidden losses like slow cycles, small stops, and extended setup times to increase output without adding machines.
Poor equipment effectiveness shows up in several ways. The most visible is unplanned downtime. But the more common and often larger losses accumulate gradually, such as machines running below ideal cycle times, small stops that add up across a production shift, and setup time that runs longer than it should.

These losses make up what manufacturers sometimes call the hidden factory, the production capacity that exists on paper but never makes it to output. For a manufacturer with meaningful room to improve utilization, the difference can represent the capacity to take on additional orders, reduce lead times, and grow revenue without a single capital expenditure.

CONTROL AND DEPLOYMENT

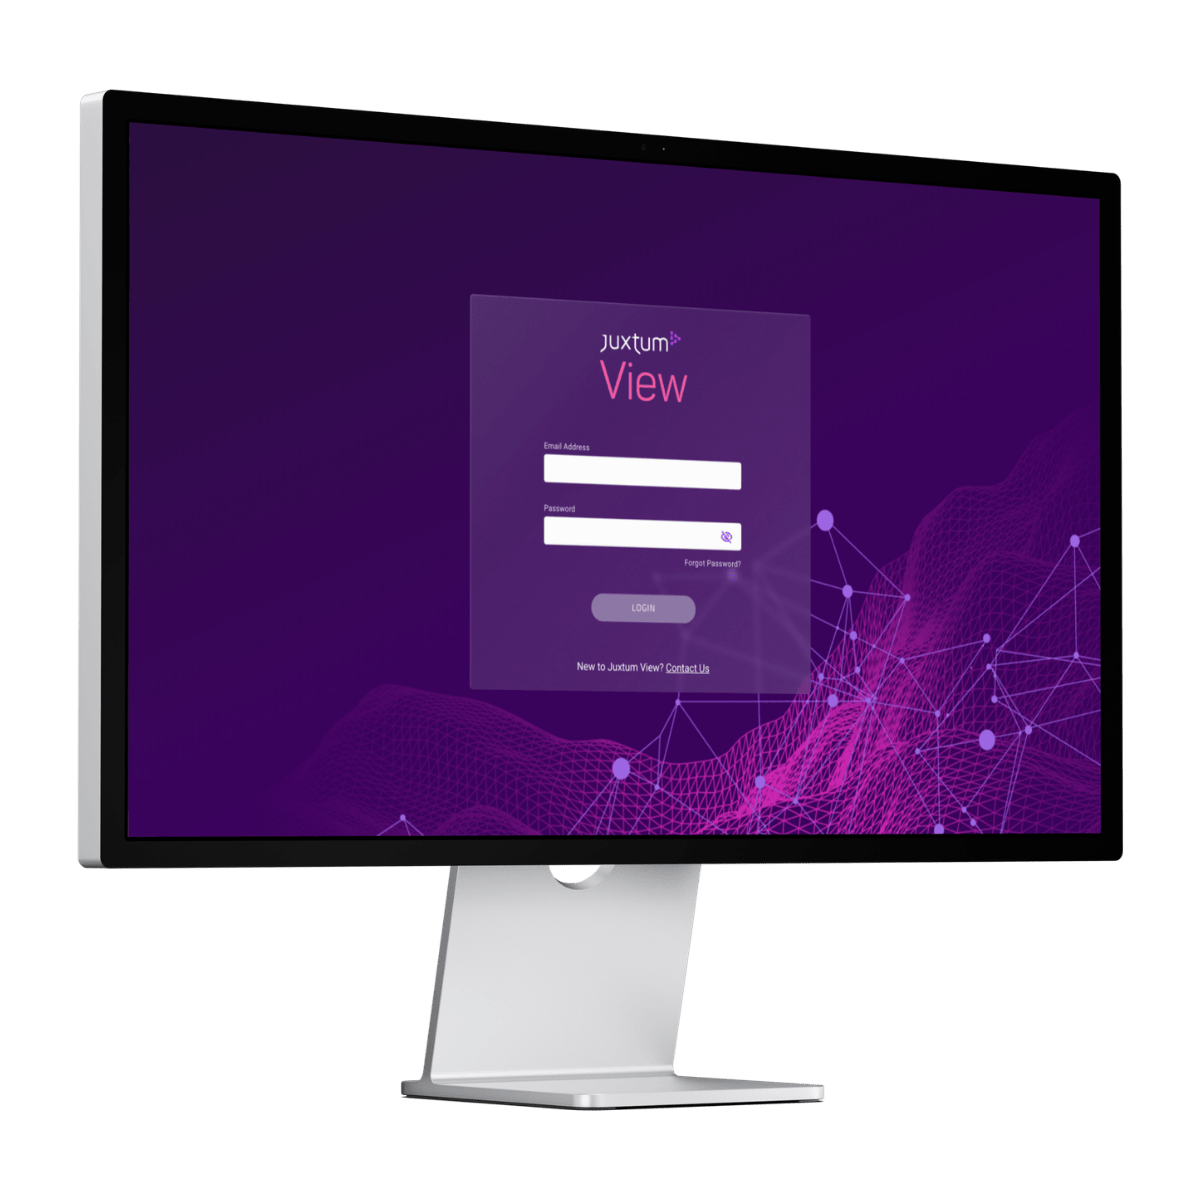
Juxtum View User Portal

Cloud or on-premise solution for data delivery and visualization. Easy dashboard configuration allows for real-time reporting and analysis, so you can make better business decisions.

DATA OUTPUT

Dashboards + Reports

Juxtum View helps you understand how effectively your equipment is being used by identifying trends, patterns, and opportunities for improvement; providing you with the information needed to improve efficiency and to increase productivity and profitability. You also have the ability to export data to pdf or csv for additional data analysis outside of the system. Unlike other machine monitoring platforms, the customer retains full control of the data once collected with Juxtum View.
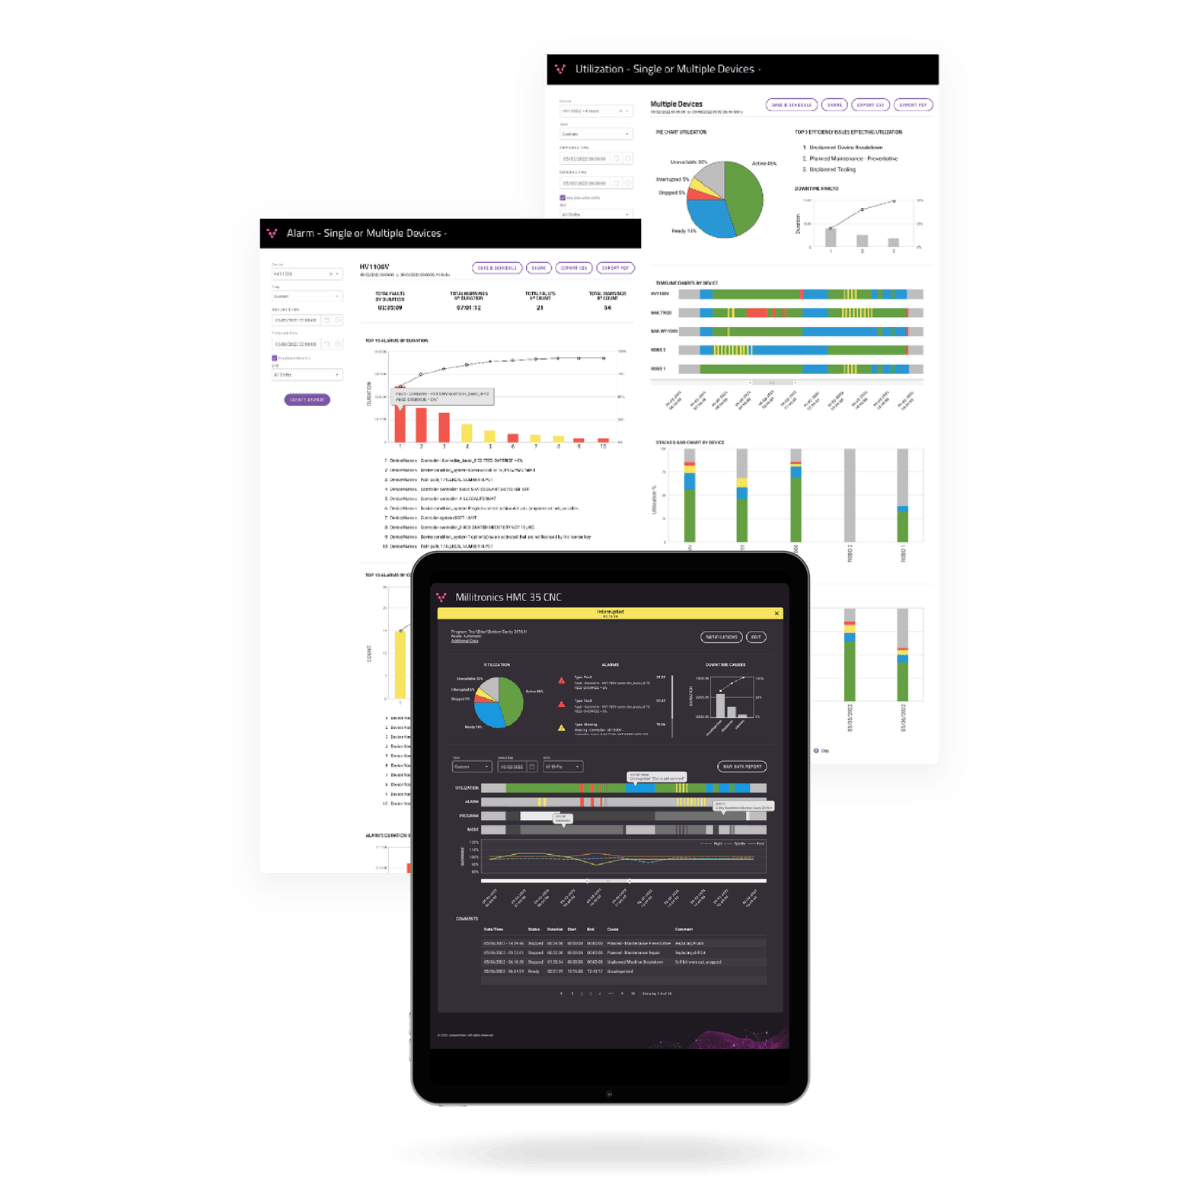
Downtime Report

Utilization Report

Alarm Report

Raw Data Report

Timelines Report

+

CAPABILITIES

What Juxtum View Delivers for OEE Monitoring

Juxtum View is a cloud or on-premises visualization platform that works alongside your existing operations. It includes built-in data collection through Juxtum Connect, meaning every connected asset on your floor feeds directly into the platform from day one.

A comprehensive real-time monitoring dashboard

See every connected asset’s status, utilization rate, alarm activity, and production output in one configurable, live dashboard. Report types include utilization, downtime, alarm, cycle time, raw data, and timeline reports, each exportable to PDF or CSV. Customers retain full control of their data, and the platform integrates with ERP systems, MES platforms, databases, and third-party analytics tools.

Standardized data collection from all equipment

Juxtum View includes Juxtum Connect, which collects standardized machine data from virtually any asset regardless of age, brand, or control type, including legacy equipment that other platforms cannot reach.

Learn more about Juxtum Connect

Condition monitoring and maintenance alerts

With Juxtum View you can continuously monitor alarm activity, drive temperatures, feed rates, spindle loads, and other machine signals. When patterns suggest a developing issue, your team is alerted before it becomes an unplanned stoppage. Across a facility running 20 or more machines, the difference between planned and emergency maintenance has a direct and measurable impact on profitability.

Fast implementation with minimal production disruption

Connect your machines without taking them offline or interrupting production. All assets and adapters are managed through a single central interface, and we work directly with your operations and engineering team to configure the platform around your specific production environment. Most facilities are up and running with live dashboard visibility within days, not months.

HIDDEN CAPACITY

Start Monitoring OEE On Your Shop Floor

Manufacturers who begin tracking OEE typically find more recoverable capacity than they expected. That capacity is already there, already paid for, and already capable of generating output. The difference is having the data to see it and act on it.

Juxtum View FAQ

Overall equipment effectiveness is a standardized framework for measuring manufacturing productivity. OEE is calculated by multiplying three factors, each of which reveals a different layer of production performance.

OEE software measures how effectively your manufacturing equipment is being used by tracking three factors: availability, performance, and quality. Juxtum View collects standardized, real-time data from every connected asset on your floor and presents it through configurable dashboards and reports, giving your operations team a consistent, accurate picture of where production losses are occurring and what is driving them.

1. Availability

The percentage of scheduled time that equipment is actually running. Availability losses include unplanned downtime, equipment failures, and changeover time that runs longer than planned.

2. Performance

How fast equipment runs compared to its ideal cycle time. Performance losses include speed reductions, minor stops, and idle time that accumulates across a shift without triggering an obvious alarm.

3. Quality

The percentage of parts produced that meet specification without rework. Juxtum View supports quality tracking, though it is more limited in scope than availability and performance monitoring. Our team can walk through exactly what View captures during a demo.

For many manufacturers, tracking OEE reveals scores that are lower than expected. That gap represents recoverable capacity. Each percentage point of improvement can translate into more parts produced, more orders fulfilled, and more revenue generated from equipment you already own.

For many manufacturers, measuring OEE for the first time reveals scores that are lower than anticipated. That gap represents recoverable capacity that is already paid for and already capable of generating output. Without a system in place to measure utilization rates, cycle times, and alarm activity, that capacity stays invisible and the losses driving it go unaddressed.

Juxtum View tracks utilization rates, cycle times, alarm activity, feed rate inconsistencies, and production gaps across every connected asset. That includes the gradual losses that rarely trigger an obvious failure but steadily reduce your OEE score over time, such as machines running below ideal cycle times, small stops accumulating across a shift, and setup time running longer than it should.

Get More From Your Shop Floor

The data you need is already in your machines. Juxtum makes it actionable so you can turn production into performance that moves your operations forward.