Production teams that depend on end-of-day summaries or manually compiled reports are often making decisions using incomplete information. By the time production data is collected, consolidated, reviewed, and distributed, the opportunity to address issues on the shop floor may have already passed.
That delay creates challenges across the operation. A machine running slower than expected, recurring downtime events, increasing repair frequency, or underutilized equipment may not become visible until production targets are missed, schedules slip, or maintenance costs rise.
What Are Manufacturing KPIs?
Manufacturing KPIs (Key Performance Indicators) are measurable metrics used to evaluate production performance, equipment effectiveness, reliability, quality, and operational efficiency. They help manufacturers quantify performance, identify trends, measure the impact of improvement initiatives, and make more informed operational decisions.
Common manufacturing KPIs include OEE, downtime, MTBF, MTTR, cycle time, throughput, and capacity utilization. Together, these metrics provide a more complete picture of how equipment, processes, and production systems are performing across the operation.
The value of these metrics depends on the quality of the data behind them. Whether the goal is improving equipment reliability, increasing throughput, reducing downtime, or recovering capacity, manufacturing KPIs are most effective when they are built on accurate, consistent, machine data.
OEE (Overall Equipment Effectiveness)
OEE is the most used manufacturing KPI for measuring production effectiveness. It does not just tell you how much was produced; it tells you why your equipment did not produce more.
How to calculate OEE:
OEE = AVAILABILITY x PERFORMANCE x QUALITY
Each component isolates a different category of production loss:
Availability
Availability measures how much of the planned production window the equipment was running. Availability losses include unplanned stoppages like equipment failures and material shortages, as well as planned stops like changeovers and scheduled maintenance that runs longer than allocated.
AVAILABILITY = RUN TIME / PLANNED PRODUCTION TIME
Perfromance
Performance measures whether the equipment ran at its ideal rate during the time it was operating. Performance losses include reduced speed, minor stops, and slow cycles. A machine running at 92% of its programmed rate for an entire shift produces a significant performance loss that rarely appears in any shift log.
PERFORMANCE = (IDEAL CYCLE TIME x TOTAL COUNT) / RUN TIME
Quality
Quality measures the percentage of parts produced that meet quality standards on the first pass, without rework. Quality losses include scrap, rework, and parts that fail inspection.
QUALITY = GOOD COUNT / TOTAL COUNT
A worked example: A machine is scheduled for 480 minutes. It experiences 45 minutes of unplanned downtime, leaving 435 minutes of run time. During that time it produces 390 parts at its ideal cycle time of one minute per part. Of those, 378 pass first-pass inspection.
– Availability: 435 / 480 = 90.6%
– Performance: (1 × 390) / 435 = 89.7%
– Quality: 378 / 390 = 96.9%
– OEE: 0.906 × 0.897 × 0.969 = 78.7%
The machine ran most of its scheduled window, maintained relatively consistent production rates, and passed nearly all of its output. Despite what seems like strong performance in individual categories, small losses in each multiply against each other, and the combined score of 80% shows where the largest opportunities sit.
What OEE Tells You and What It Does Not
OEE surfaces which category of loss is driving underperformance. A low availability score points toward unplanned downtime or extended changeovers. A low performance score points toward slow cycles or minor stops that do not trigger alarms. A low quality score points toward process instability or equipment issues showing up as scrap and rework.
What OEE does not tell you, on its own, is which specific machine is the source or what the root cause is. That requires machine-level data at the asset level, not a rolled-up line or facility score. A facility OEE score is useful for tracking trends over time. Asset-level OEE data is what drives targeted improvement.
OEE captures losses that never appear as formal failures: cycle time drift, operator-driven speed adjustments, and minor stops that resolve in under a minute. None of these register as downtime in a shift report. All of them reduce OEE. Measuring it accurately requires continuous, automated data collection from every connected asset.
OEE Benchmarks in Practice
A score of 85% is widely cited as a world-class OEE threshold, though appropriate targets vary by industry, production environment, product mix, and regularly requirements. The more actionable goal for most facilities is a consistent upward trend from wherever they currently sit, tracked against stable definitions applied the same way across every asset and every shift. Each percentage point of OEE improvement translates directly into more output from equipment already owned, without additional capital investment.
To go deeper on the full framework and benchmarks, read OEE in manufacturing.
Downtime: Planned Vs. Unplanned, And Why The Distinction Matters
Downtime is often treated as a simple metric: was the machine running or not? In practice, it is considerably broader, and the distinction between planned and unplanned downtime is what makes it useful as a manufacturing KPI rather than just a count of stopped machines.
What Counts as Downtime
Planned downtime includes scheduled maintenance, changeovers, and shift transitions. These are expected, budgeted, and factored into the production schedule.
Unplanned downtime includes unexpected interruptions that prevent production from continuing as planned. Common examples include equipment failures, alarm events, material shortages, quality holds, and upstream or downstream process constraints that stop production. A batch waiting on QA approval or a machine sitting idle because a downstream station is backed up would both be considered unplanned downtime.
Not every production loss is downtime. A machine running slower than its standard cycle time, an operator reducing feed rates to prevent scrap, or frequent minor speed reductions are typically classified as performance losses rather than downtime. While these events reduce output, the equipment is still producing parts.
Both downtime and performance losses reduce overall production effectiveness, which is why manufacturers often track them together when evaluating operational performance.
Tracking downtime by category, not just duration, is what makes it actionable. Knowing a machine was down for 90 minutes is less useful than knowing it was down because of a recurring alarm pattern that appeared on three prior shifts. The second version of that data points directly to a maintenance decision.
How to Calculate Downtime Rate
A machine idle for 90 minutes in a 480-minute scheduled shift has a downtime rate of 18.75%. That number is a starting point. The next question is always: what caused it, and is the cause recurring?
DOWNTIME RATE = DOWNTIME (MINUTES OR HOURS) / SCHEDULED PRODUCTION TIME
The Relationship Between Downtime and OEE
Unplanned downtime directly reduces the Availability component of OEE. Reducing unplanned downtime is, for most facilities, the fastest path to OEE improvement. That is why condition monitoring matters: The alarm patterns, drive, temperatures, feed rate behavior, and signal data surfaced through machine monitoring provide additional context for maintenance teams working to improve reliability. Combined with preventative maintenance practices, operator observations, and maintenance planning, these insights can be contribute to longer MTBF over time. When that data is continuous, maintenance teams can act on what is developing rather than responding after production has already stopped.
MTBF and MTTR: Measuring Equipment Reliability and Maintenance Response
Mean Time Between Failures (MTBF) and Mean Time to Repair (MTTR) are the two manufacturing KPIs that most directly reflect equipment reliability and maintenance effectiveness. Together, they tell operations teams how often equipment fails and how quickly the facility recovers.
Mean Time Between Failures (MTBF)
MTBF measures how reliable a piece of equipment is over time. A rising MTBF indicates improving reliability, or fewer failure events per operating hour. A declining MTBF may indicate developing equipment issues, maintenance challenges, operating condition changes, or process instability. Monitoring trends over time helps teams identify reliability concerns before they result in significant production disruptions.
Tracking MTBF per asset, rather than across a facility average, is what makes it useful. A single machine pulling down a line’s aggregate MTBF score points directly to where maintenance attention is needed. A gradual downward trend in one CNC’s MTBF over several weeks points to a developing issue that condition monitoring can address before it becomes an unplanned stoppage.
MTBF = TOTAL OPERATING TIME / NUMBER OF FAILURES
Mean Time to Repair (MTTR)
MTTR measures how quickly the maintenance team can return equipment to production after a failure. High MTTR points to parts availability issues, diagnostic delays, or skill gaps in the maintenance team. A facility with consistent MTBF but rising MTTR has a recovery problem, not a reliability problem, and the corrective path is different.
MTTR = TOTAL REPAIR TIME / NUMBER OF REPAIR EVENTS
Using MTBF and MTTR Together
The combination of these two metrics creates a complete picture of equipment reliability and maintenance capacity. A facility with high MTBF and low MTTR has reliable assets and fast recovery. A facility with low MTBF and high MTTR faces compounding losses: failures happen frequently, and each one takes a long time to resolve.
The alarm patterns, drive temperatures, feed rate behavior, and signal data that continuous machine monitoring surfaces are what enable teams to move MTBF upward. Catching a developing failure early means scheduling a repair during planned maintenance rather than recovering from an unplanned stoppage. Over time, that shift from reactive to condition-based maintenance improves both metrics.
Cycle Time and Throughput: Where Process Optimization Shows Up in the Data
Cycle Time
Cycle time is the total time required to complete one unit through a production process.
One distinction worth keeping clear: cycle time is process-driven, measuring how long production takes. Takt time is demand-driven, measuring how fast production needs to run to meet customer requirements. They are related, but they measure different things.
The value of tracking cycle time at the asset level is finding drift that never triggers an alarm. A CNC running 8% slower than its standard cycle time produces a meaningful throughput loss over a full shift. That drift rarely shows up in a shift report. Without continuous data collection from that specific machine, it stays invisible until it appears in a missed production target at the end of the week.
Cycle time variability across shifts is equally telling. If the same machine produces different cycle times on day shift versus night shift, that is a data point about operator setup, tooling management, or program adjustments being made on the floor that never get captured upstream. Asset-level cycle time data surfaces those patterns.
CYCLE TIME = TOTAL PRODUCTION TIME / NUMBER OF UNITES PRODUCED
Throughput
Throughput is the output KPI that connects most directly to revenue. More good parts from the same equipment means more capacity to fill orders without capital expenditure. It measures what matters at the end of a shift: how many conforming parts reached completion.
Throughput improves when all three OEE components improve, because fewer losses at any stage mean more parts reaching the end of the process. A throughput shortfall can be traced back through OEE components to identify whether the constraint is availability, performance, or quality, and at which asset on the line.
THROUGHPUT = TOTAL GOOD UNITES / TIME PERIOD
Why Asset-Level Data Changes What These KPIs Can Tell You
Aggregate line and facility numbers hide where the constraint actually is. A line that appears to be performing within plan may have one CNC running 12% below ideal cycle time while another sits idle between jobs, the two effects canceling out in the rolled-up number while each represents a recoverable opportunity. That is why throughput, OEE, and utilization only become actionable when they can be traced to the individual asset producing the loss.
Capacity Utilization: The Gap Between Assumed and Actual Performance
How to calculate Capacity Utilization:
CAPACITY UTILIZATION = (ACTUAL OUTPUT / MAXIMUM POSSIBLE OUTPUT) x 100
A worked example: A machine is scheduled to produce 400 parts during a shift based on available labor and planned changeovers. At the end if the shift, the cell produces 260 parts.
Capacity Utilization = (260/400) x 100 = 65%
In this example, the machine cell achieved 65% of its planned capacity for that shift. The execution gap may be the result of unplanned downtime, cycle time drift, extended changeovers, material shortages, or other operational factors that reduced output during the shift. Tracking utilization helps manufactures understand how effectively available production capacity is being used and where opportunities for improvement exist.
Why Utilization Gaps Are Rarely Obvious Without Data
Small losses accumulate across shifts and machines in ways that look routine until they are measured:
– A machine sitting idle for four minutes between jobs while a downstream station finishes setup.
– A spindle override used consistently on one asset to prevent scrap on a specific part family.
– Tool changes running longer on night shift than on day shift.
None of these individually looks significant. Together, they add up to meaningful lost capacity per shift that never appears in a manual report because no one recorded it.
These are the patterns that facilities discover when they move from manual tracking to continuous, automated data collection from every connected asset. The gap between assumed utilization and actual utilization is often larger than expected when measured accurately for the first time.
Connecting Utilization to Revenue
Recoverable utilization on equipment already owned is a revenue opportunity. Each percentage point of improvement translates into additional output capacity that can be quoted, scheduled, and shipped without new machines or additional headcount.
The gap between scheduled run time and actual production time is often wider than teams expect, and it stays invisible until it is measured continuously at the asset level. Once that gap is visible, the idle minutes it represents become recoverable output that can be quoted, scheduled, and shipped, using equipment that is already owned, staffed, and running. No capital investment required.
How Manufacturing KPIs Work Together: From Individual Metrics to Shop Floor Intelligence
No single manufacturing KPI tells the complete story.
OEE tells you production effectiveness, but not which asset is the source of the loss. Downtime analysis tells you where availability is being lost and whether it is planned or unplanned. MTBF and MTTR tell you how reliable your equipment is and how quickly you recover from failures. Cycle time tells you where performance losses are hiding across assets and shifts. Throughput tells you what the line is producing versus what it is capable of. Capacity utilization tells you the gap between potential and actual output.
Together, these manufacturing KPI metrics create a layered picture of shop floor performance that supports faster, more confident decisions at every level of the operation. An engineer diagnosing a throughput shortfall can trace it through OEE components to a specific machine running below ideal cycle time, then check that machine’s MTBF trend and alarm history. An operations manager reviewing weekly performance can see whether a utilization gap is driven by unplanned downtime on one asset or a scheduling constraint affecting the whole line.
The connecting thread is data quality. These KPIs are only as reliable as the data feeding them. Manual collection and end-of-shift reporting produce KPI data that reflects what someone recorded, not what the machines were doing. Continuous, automated, asset-level data collection is what makes these KPIs accurate enough to act on.
Putting Manufacturing KPIs to Work: What Real-Time Data Collection Makes Possible
When KPI data is collected automatically and continuously from every asset on the shop floor, the operational picture changes in concrete ways:
– Production decisions are based on facts rather than estimates.
Cycle time comparisons across shifts are accurate. OEE scores reflect what happened on every machine, not just the events that were logged. Utilization gaps show up as data points, not end-of-week surprises.
– Maintenance teams can act on condition signals before failures occur.
The alarm patterns, temperature trends, and feed rate deviations that precede a failure are visible in the data hours or days before the stoppage. That lead time is the difference between a planned repair at scheduled maintenance and an emergency service call.
– Operations leadership has an accurate, multi-site view of utilization and throughput when data collection is standardized across facilities.
Process improvement initiatives have an objective baseline to measure against, and every intervention produces a data record that shows whether it held.
Manufacturing KPI dashboards that update in real time, built on standardized machine data from every connected asset, are what transform these metrics from historical records into operational tools. The right manufacturing reporting software connects directly to machine data at the source, eliminating the manual consolidation steps that introduce delays and gaps between what happened on the floor and what leadership sees.
How Juxtum Helps Manufacturers Track and Act on Manufacturing KPIs
Manufacturing KPIs require accurate, continuous, machine-level data to be reliable.
Juxtum Connect uses patented adapter software to collect and standardize real-time data from any manufacturing asset, regardless of brand, age, or control type. When a license key is issued, the software automatically discovers each machine’s unique configuration, including its axes, spindles, and geometry, without interrupting production.
For most CNC machines, data is flowing in approximately five minutes. No manual configuration. No downtime. As an official Siemens Product Partner, Juxtum provides dedicated adapters for the 840D and SINUMERIK line, giving operations teams running Siemens controls full access to machine data from those assets.
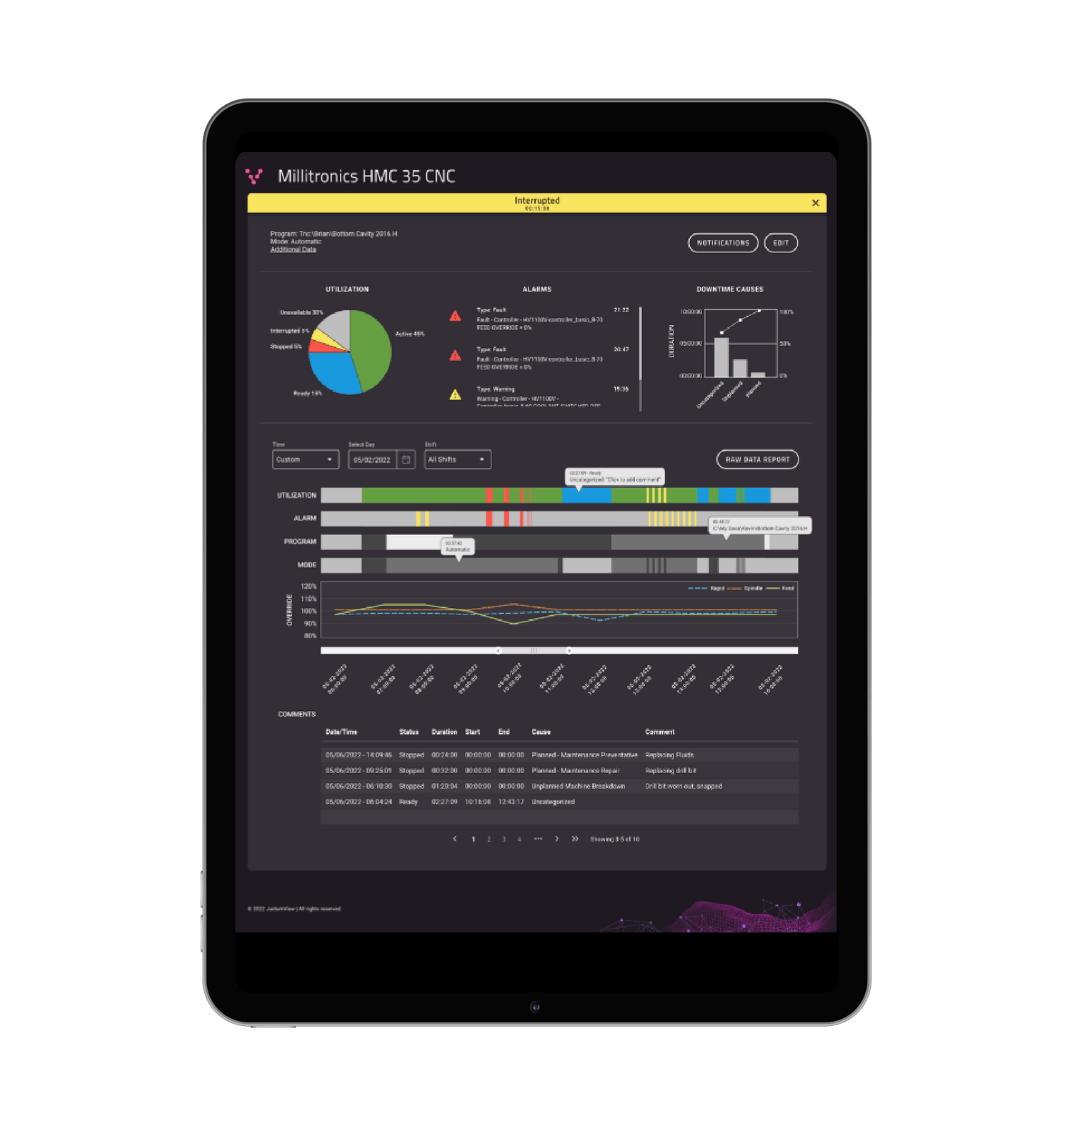
That data is standardized using the MTConnect ANSI standard format and feeds directly into Juxtum View, a real-time monitoring and analytics platform. Juxtum View surfaces OEE components, utilization rates, downtime events, alarm patterns, and cycle time analytics through configurable dashboards and reports, giving operations managers and engineers a live, accurate view of how every connected asset is performing. Customers retain full control of their data, and the platform integrates with ERP systems, MES platforms, databases, and third-party analytics tools. The same data foundation that supports OEE tracking and downtime analysis today can support condition monitoring and more advanced analysis as the operation grows, with no solution swap required.
Juxtum View deploys in the cloud or on-premises depending on your operation’s security requirements. See how cloud vs on premise vs hybrid options compare.
Frequently Asked Questions
What is OEE and how do you calculate it?
OEE (Overall Equipment Effectiveness) measures how much of a machine’s planned production time is genuinely productive. It is calculated by multiplying Availability (run time divided by planned production time), Performance (actual output rate versus ideal cycle time), and Quality (good parts divided by total parts produced). A score of 85% is widely cited as a world-class threshold, though most operations run below that, and a consistent upward trend tracked against stable definitions is the more actionable goal.
What is the difference between MTBF and MTTR?
MTBF (Mean Time Between Failures) measures equipment reliability: the average operating time between failure events. A higher MTBF means the asset fails less frequently. MTTR (Mean Time to Repair) measures how quickly equipment is returned to production after a failure. MTBF trending downward signals a developing reliability problem. MTTR trending upward signals a recovery or maintenance capacity problem. Tracking both together shows how often equipment fails and how well the operation handles it.
How does unplanned downtime affect OEE?
Unplanned downtime reduces the Availability component of OEE directly. Because OEE is the product of all three components, an availability loss multiplies against performance and quality to compress the final score. Unplanned downtime is typically the largest single driver of low OEE scores. This is why condition monitoring is one of the highest-leverage paths to OEE improvement. Catching the signals that precede failures before a stoppage occurs gives maintenance teams time to act.
What data do you need to track manufacturing KPIs accurately?
Accurate KPI tracking requires continuous, automated, machine-level data from every connected asset. The data points that feed OEE, downtime analysis, MTBF, and cycle time tracking include axis positions, spindle loads, feed rates, drive temperatures, overrides, alarm events, run times, and part counts. For operations running a mix of CNC machines, PLCs, and other assets from different vendors, that data needs to be standardized at the collection point so it is directly comparable across machines, shifts, and facilities.